Beyond Basic Reporting
In-depth. Detailed. Complete. myCasiola’s strength lies in its reporting capabilities, giving you more detail than you ever thought you’d need. See every little detail and insight about your property with myCasiola Reporting.
In-depth. Detailed. Complete. myCasiola’s strength lies in its reporting capabilities, giving you more detail than you ever thought you’d need. See every little detail and insight about your property with myCasiola Reporting.
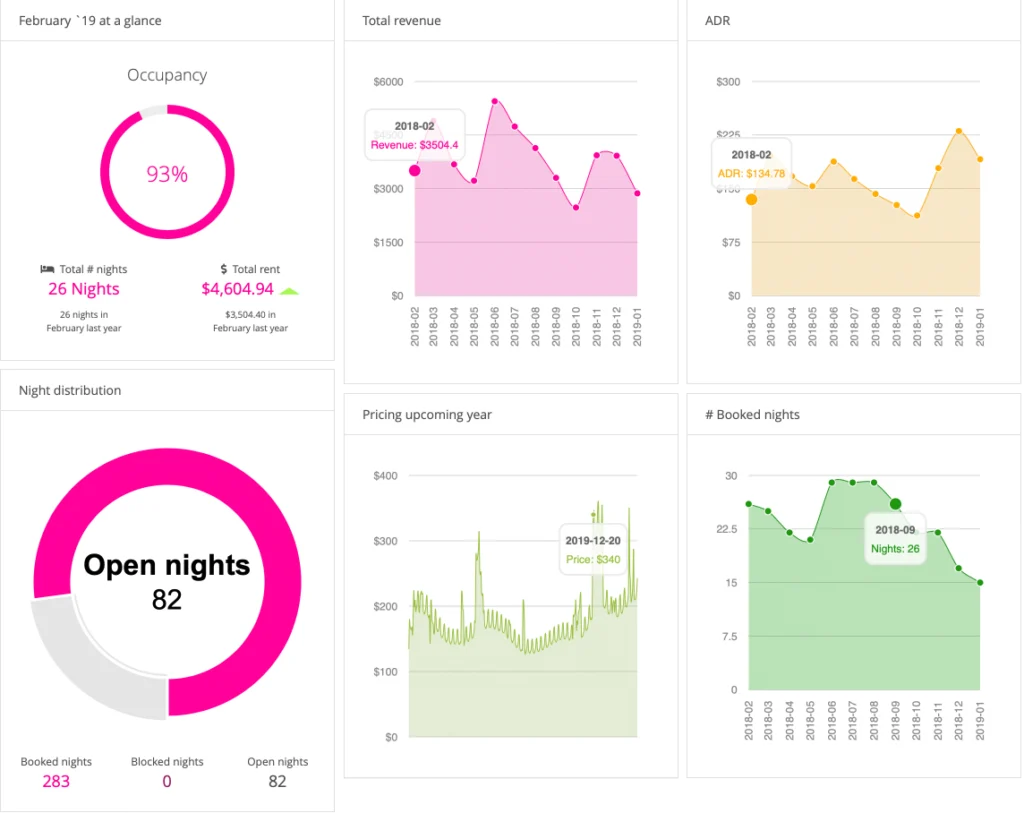
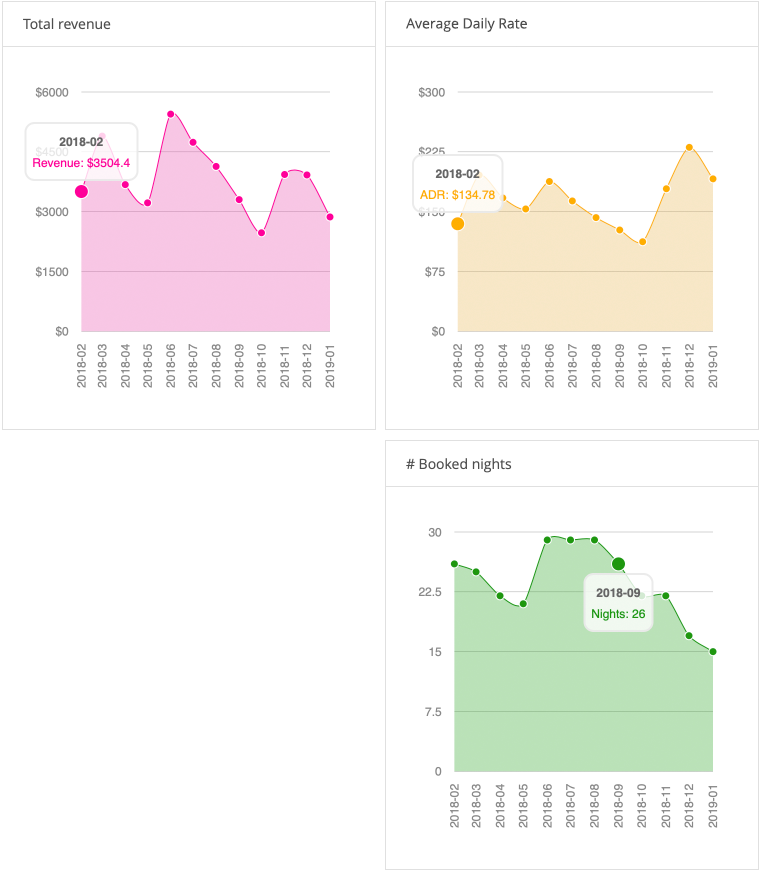
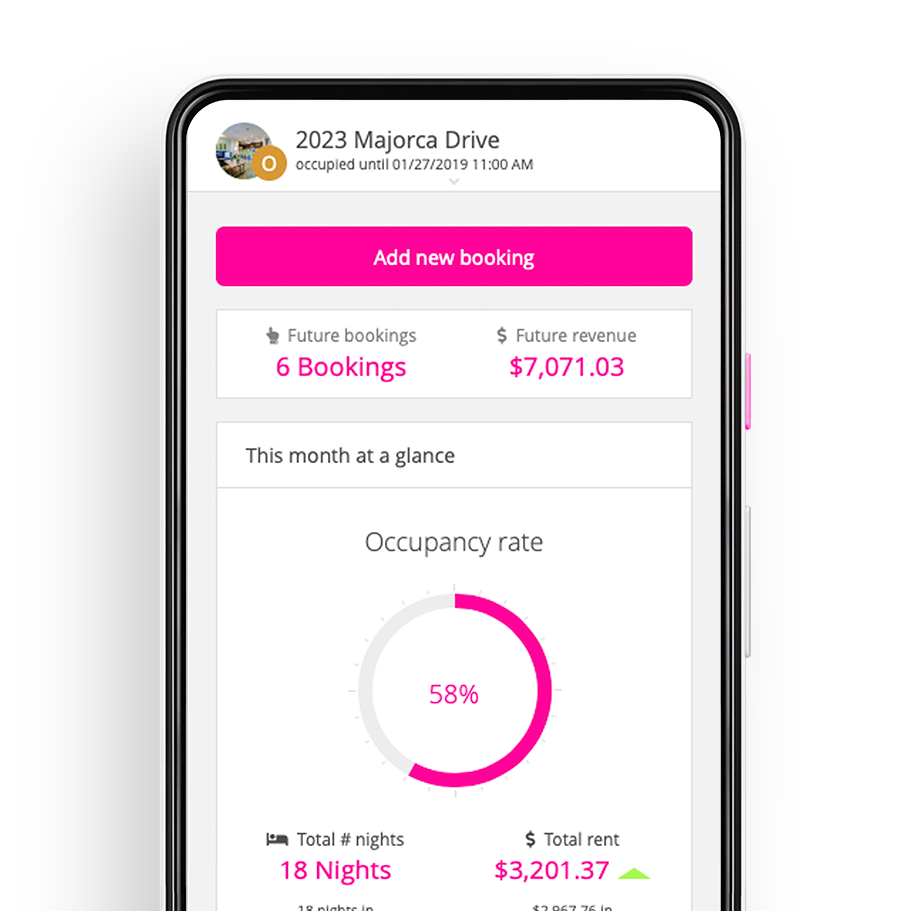
How’s your vacation home really doing? Get an in-depth look at your property’s revenue, average daily rate and number of nights booked. myCasiola makes it easy to spot trends for your home and what’s working.

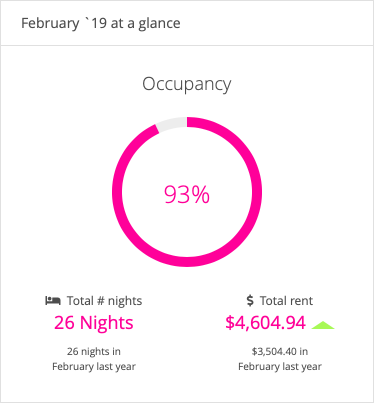
Compare this year to last year, one month to another month, all right from your dashboard. See all the occupancy rates for a month, calculated by comparing the number of booked nights to overall available nights. A quick overview on your dashboard with the comparison between this year and last year plus the occupancy rate for the month. Occupancy is calculated as the number of booked nights over the available nights.

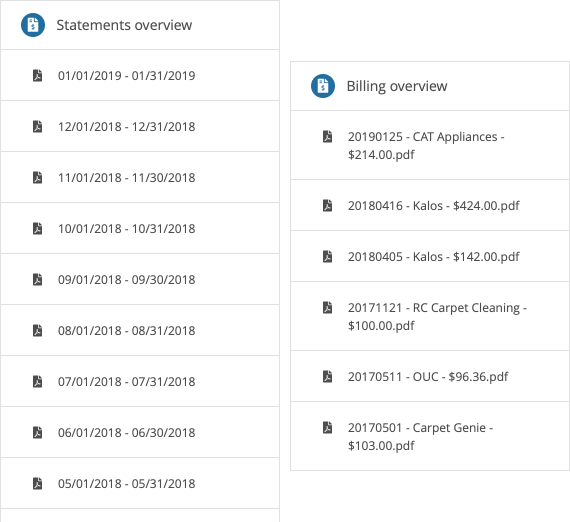
See exactly where your money is going and how it’s coming in with our document management feature. Check out current and past statements, plus any bills we have paid on your behalf.

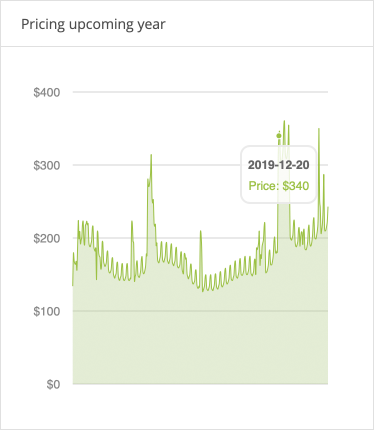
One of the most interesting charts on the report page, your property’s forecast shows projected revenues per night. The forecasting feature also gives hints on potential busy periods so you can capitalize on the increased demand.

Are you interested in the reporting features of myCasiola? Leave your email address below and we’ll contact you as soon as possible!