
The 2026 Orlando STR market has changed a lot. If you own a property near the parks or downtown, you’ve likely noticed that simply having a nice listing and a “Welcome” mat isn’t enough anymore.
Recent performance data highlights a growing divide between properties that are simply occupied and those that are truly optimized. The result is up to 32% in total revenue.
The RevPAR reality check
In the world of STRs, occupancy is a vanity metric; RevPAR (Revenue Per Available Room) is the reality.
Current data shows a stark contrast in Orlando:
-
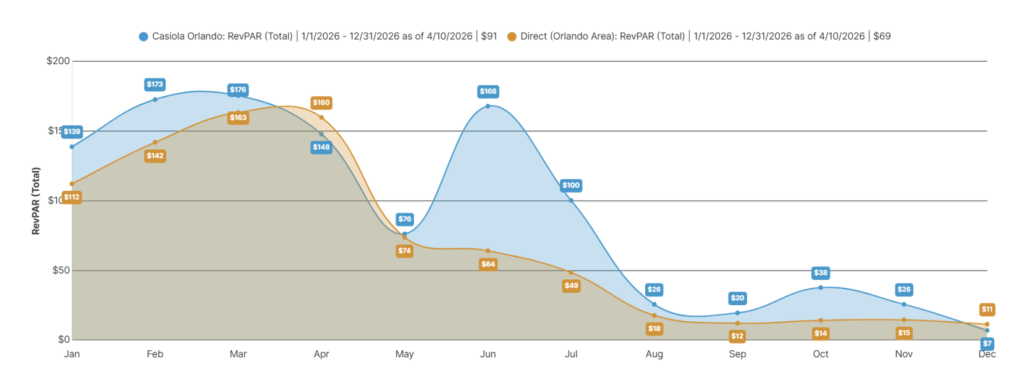
Market Average RevPAR: $69
-
Top-Performing Properties (Casiola): $91
While a $22 difference might seem small per night, it scales aggressively. For a standard property, this gap translates to $500 to $2,500 more per month. Over the course of a year, that is the difference between “breaking even” and a $25,000 profit.
The booking window advantage
One of the biggest stressors for owners is the “Dead Calendar” anxiety. When you don’t see bookings for next month, the natural instinct is to slash prices.
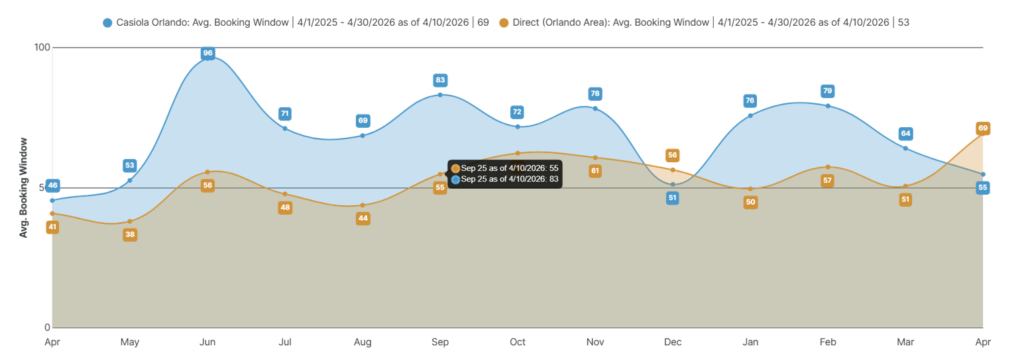
However, top performers are winning because they capture demand earlier. The data shows Casiola properties have a 69-day booking window, compared to the 53-day market average.
By securing guests 16 days sooner, these owners maintain pricing power. They aren’t forced into last-minute “fire sales” to fill gaps because their calendar was already spoken for over two months ago.
Slow monhts (August – December)
Anyone can fill a house during Spring Break or Christmas. The real test of a management strategy happens when demand dips.
Looking back at the RevPAR trends, the performance gap in Orlando widens significantly between August and December:
-
Market RevPAR: Dips as low as $12 – $14
-
Optimized RevPAR: Stays resilient at $20 – $38
That is a 67% stronger performance during low-demand periods. While other owners are looking at empty weeks, optimized properties are leveraging sophisticated revenue management to keep the cash flow consistent.
Paid occupancy vs. “Busy-ness”
Is your calendar full because people are paying full price, or because you’ve blocked off dates or given heavy discounts?
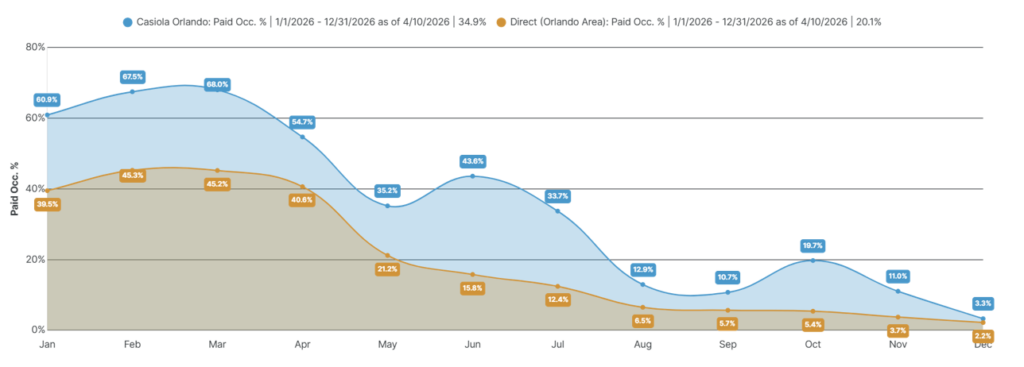
Top-performing properties are seeing a massive advantage in actual Paid Occupancy (nights guests actually paid to stay) and Adjusted Paid Occupancy.
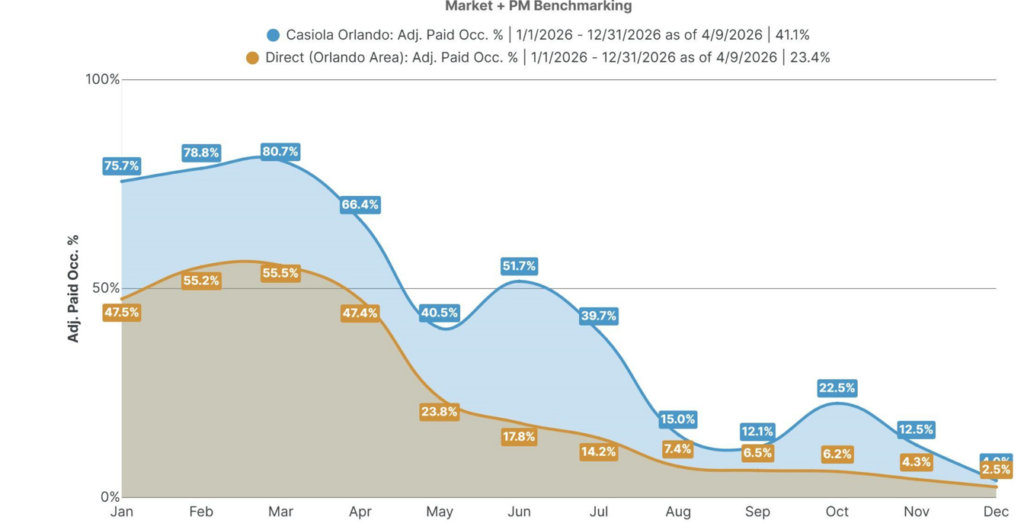
When we look at the adjusted numbers, the difference is even more staggering: 41.1% Adjusted Paid Occupancy for Casiola compared to just 23.4% for the rest of the market.
(Insert Image Here) [Image File: adj paid occ%.jpg] Alt-text: Market and property management benchmarking graph showing Casiola at 41.1% adjusted paid occupancy vs 23.4% market average.
This indicates a superior ability to convert “browsers” into “paying guests” through high-intent pricing and professional distribution. Rather than relying on blocked dates or discounted bookings, high-performing properties consistently turn availability into revenue.
How does your property rank?
Data doesn’t lie, but it can be sobering. If your property isn’t hitting these 2026 benchmarks, you aren’t just losing money—you’re working harder for lower returns.
The 2026 market rewards the math-driven owner. Whether you’re self-managing or with another agency, it’s worth asking:
Is my property performing at its true potential?
Stop Guessing.
Get the Data.
Want to see exactly how your property stacks up against these 2026 trends? Request your personalized revenue estimate and see what your property should be earning.
(Data source : Keydata)

